(di bawah adalah versi Bahasa Indonesia)
Abstract:
Most retail shops and local markets in Indonesia offer plastic bags for free to their customers. But while many may think plastic bags are a convenient gift by the retailers, the true price is eventually paid by the Indonesian economy, environment and thereby society at large.
Our study finds that the hidden economic costs of plastic bags to Indonesians amount to over 2,91 Billion USD each year. We used global estimates on loss of revenue for the fishery and tourism sector due to plastic pollution, applied them to the specific economic data of Indonesia and also added the annual cost of plastic bags distributed in Indonesia. Due to a lack of data on further pollution costs, such as health costs (burning plastic bags), costs due to flooding (plastic bags clogging water ways) etc., our estimates account only for a fraction of the total economic costs of plastic bag use to Indonesians. It may be safe to assume that the true costs borne by the use of plastic bags in Indonesia are well beyond 3 Billion USD a year.
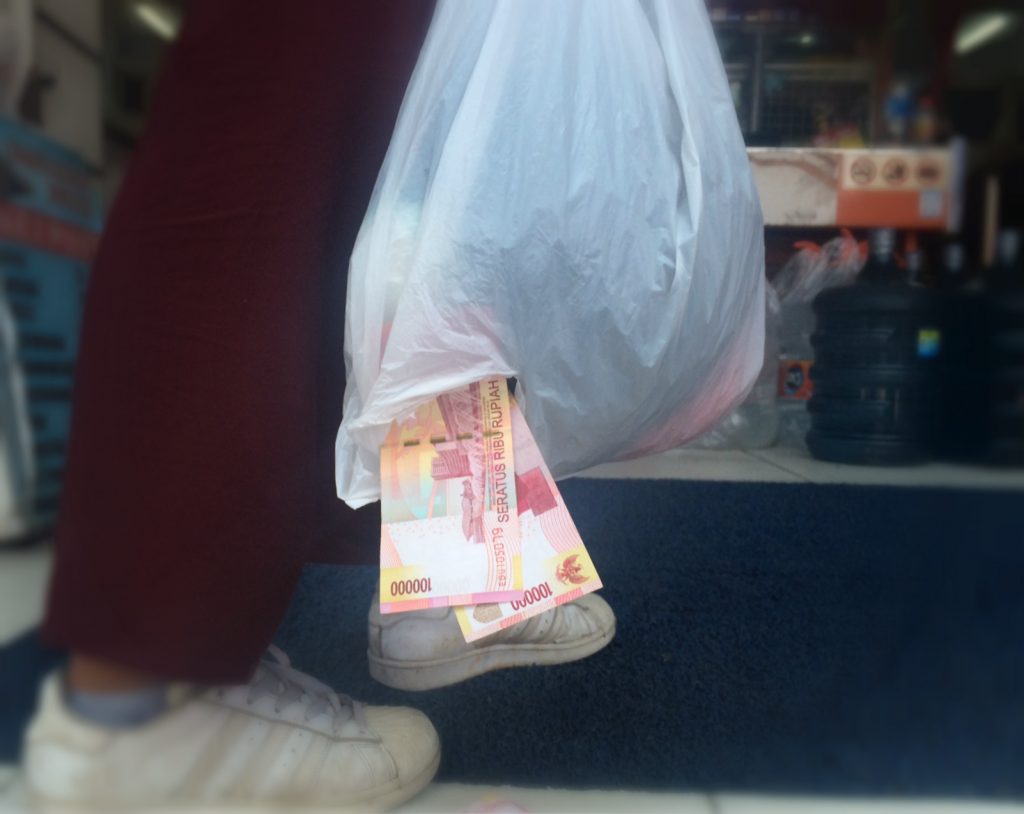
Plastic bag use and pollution costs Indonesians more than 2,9 Billion USD each year. (Image: Making Oceans Plastic Free)
Introduction
It is estimated that every day almost 500 Million plastic bags are distributed across Indonesia (Jakarta Post /Greeneration 2016). Since governmental or private waste management services are still far from covering most households and businesses, around 40% of plastic waste eventually ends up in the sea surrounding the archipelago. Only behind China, Indonesia is the world’s second largest contributor to marine plastic pollution, accounting for 16% of the global marine plastic litter (Jambeck et al 2015).
There are significant negative effects towards the eco-system and socio-economic aspects of people’s lives. Marine life suffers from getting entangled in plastic waste and also ingesting it, threating reproductive health and also resulting in death (e.g. Cole et al. 2011). Human health is also at risk. Whether through microplastics in marine food or drinking water, plastic pollution is likely to have adverse health effects towards human beings (e.g. Schirinzi et al 2017). There are a number of factors based on the production, use and pollution by plastic bags that are detrimental to the ecosystem and people’s socio-economic wellbeing.
Aim and limitations of study
It should be the goal of further research to uncover and analyze the full extent of the hidden economic costs of plastic bags and other waste. To value these effects in monetary terms will allow for governments and society to be better informed about true costs, and thereby facilitate policies more in line with people’s preferences. It is this larger framework this study aims to contribute to.
There are several limitations in the estimations we conduct. First, we are only looking at a small part of the hidden costs of plastic bags. We focus on revenue loss in the tourism and fishery sector. Second, we only look at the direct loss of revenue, but due to a lack of data, can not include related costs, such as e.g. arising from loss of employment in these sectors. Third, we have not been able to include the environmental costs in the production of plastic bags, e.g. CO2 emissions. Fourth, to calculate the loss of revenue for tourism and fishery sectors, in Indonesia, we further had to rely on global estimates. These estimates may vary strongly across different countries, with preferences and sensitivities of tourists in respective regions. Only through specific regional research in the future, we can gradually improve these estimates and validity of calculated costs.
A cost factor this study covers is that we do take into consideration the product costs of plastic bags. We have been able to include the price retailers pay for plastic bags and indirectly passing these costs through increased product prices forward to customers.
The study at hand is presented as a working paper and therefore represents a first contribution towards this important topic. We want to encourage others to help improve estimations by adding data on relevant cost effects arising from the use and pollution by plastic bags. Ideally and over time we will increase the validity of the estimations by specifying relevant data both, by covering the effects more comprehensively, and more accurately.
Analysis
Our calculations are based on data from a variety of different sources providing the relevant figures to allow estimations for the specific case of Indonesia and Bali.
We used the following data to include into our estimations:
- Average annual amount of plastic bags /per capita in Indonesia:
a.) 700 (Jakarta Post / Greeneration 2016)
2. Average weight of plastic bag in Indonesia:
a.) 7 grams (own assessment)
3. Plastic waste by Indonesia ending up in the ocean:
a.) 40% (Jambeck et al. 2015)
b.) Total of 1,29 Million tons (Jambeck et al. 2015)
4. Population of Indonesia:
a.) 261 Million (Worldbank 2017)
5. Population of Bali:
a.) 4,2 Million (Jakarat Post 2012)
6. Tourists in Bali:
a.) 4 Million a year, average length 7,7 days (DISPAR 2016)
7. Export Value from Fishery Sector in Bali:
a.) 135.751.566 USD (Gubernur Bali, 2015)
8. Production Value from Fishery Sector in Indonesia:
a.) 4.042.032.330 USD (Jakarta Post 2015)
9. Revenue from Tourism in Bali:
a.) 40% from national revenues (Tribunnews 2017)
10. Revenue from Tourism in Indonesia:
a.) 11.567.000.000 USD (Lexas/ UNWTO 2014)
11. Revenue loss to fisheries due to plastic pollution:
a.) 2% (UNEP 2014)
12. Revenue loss to tourism due to plastic pollution:
a.) 3% (UNEP 2014)
13. Product cost of plastic bag:
a.) 200 IDR (Aseantoday.com/ ARPINDO 2016)
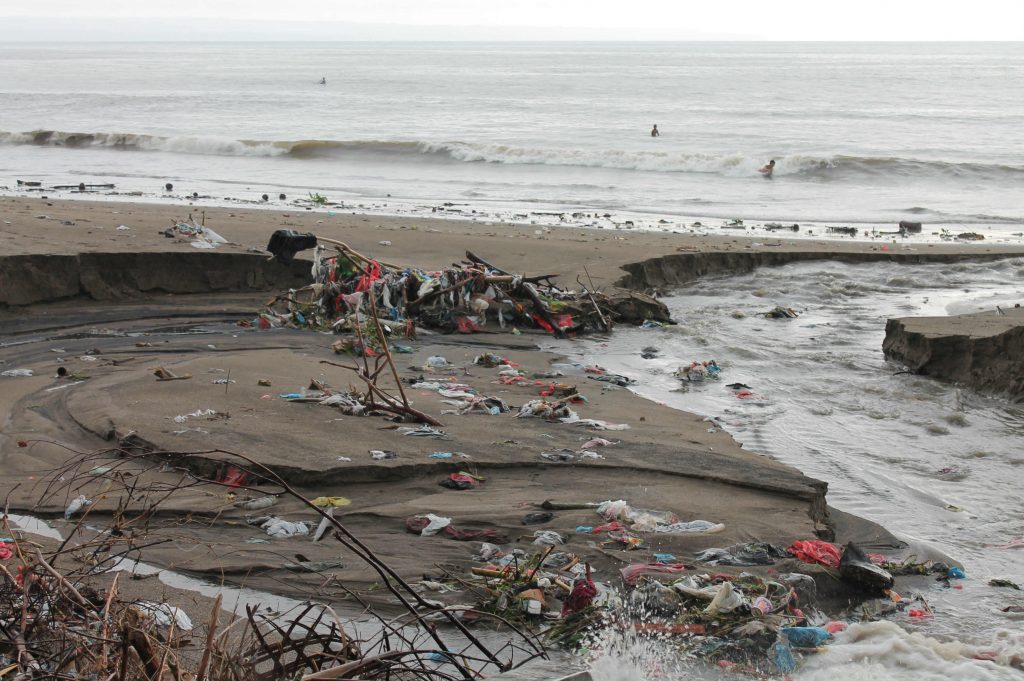
Plastic Bag Pollution causing an estimated 138 Million USD loss of revenues to the Indonesian tourism sector each year. (Image: Making Oceans Plastic Free)
Estimations:
I. Annual Use of plastic bags in Indonesia:
a.) 700 (plastic bags a year per capita) x 261.000.000 (Population of Indonesia)
= 182.700.000.000 plastic bags
II. Annual total weight of plastic bag waste in Indonesia:
a.) 182.700.000.000 (annual use of plastic bags in Indonesia) x 7 grams (average weight per plastic bag)
= 1.278.900 tons
III. Annual weight of plastic bag waste ending up in the ocean in Indonesia:
a.) 40% of 1.279.900 tons
= 511.560 tons
IV. % of plastic bag waste of all plastic waste in Indonesia:
a.) 511.560 tons (plastic bag waste) / 1.290.000 tons (plastic waste)
= 40%
V. Annual loss of revenue to Indonesian fishery sector due to plastic bag pollution
a.) 40% (share of plastic bag waste) of 2% (annual loss of revenue in Fishery sector due to plastic pollution)
= 0,8% revenue loss in fishery sector due to plastic bag pollution
b.) 0,8% of 4.042.032.330 USD (annual revenue from fisheries in Indonesia)
= 32.336.258 USD
VI. Annual loss of revenue to Indonesian tourism sector due to plastic bag pollution:
a.) 40% (share of plastic bag waste) of 3% (annual loss of revenue in tourism sector from plastic pollution)
= 1,2% revenue loss in tourism sector due to plastic bag pollution
b.) 1,2% of 11.567.000.000 USD (annual revenue from tourism in Indonesia)
= 138.804.000 USD
VII. Annual product cost of plastic bags in Indonesia:
a.) 0,015 USD (200 IDR) * 182.700.000.000 plastic bags
= 2.740.500.000 USD
VIII. Combined annual costs of plastic bags in Indonesia (loss in revenue from fishery sector, tourism, and plastic bag product cost):
a.) 32.336.258 USD (loss in revenue in fishery sector) + 138.804.000 USD (loss in revenue in tourism sector) + 2.740.500.000(plastic bag product costs)
= 2.911.640.258 USD
IX. Annual weight of plastic bag waste in Bali:
a.) 4.200.000 (population of Bali) x 700 (annual use of plastic bags per capita)
= 2.940.000.000 (annual amount of plastic bags used by population of Bali)
b.) 2.940.000.000 plastic bags x 7 grams
= 20.580.000.000 grams
= 20580 tons
c.) 4.000.000 (annual amount of tourists to Bali) x 7,7 days (average days of tourist stay)
= 30.800.000 tourist days
d.) 700 plastic bags a year/ 365 days
= 1,92 average use of plastic bags per capita per day
e.) 30.800.000 (tourists days) x 1,92 (average use of plastic bags per capita per day)
= 59.136.000 annual plastic bag use by Bali tourists
f.) 59.136.000 plastic bags x 7 grams
= 413.952.000 grams
= 414 tons
g.) 20580 tons (annual weight plastic bag waste population of Bali) + 414 tons (annual weight plastic bag waste Bali tourists)
= 20.994 tons
X. Annual weight of plastic bag waste ending up in the ocean in Bali:
a.) 40% of 20.994 tons
= 8398 tons
XI. Annual amount of plastic bag from Bali ending up in the ocean:
a.) 8.398.000.000 grams of plastic bag waste / 7 grams
= 1.199.714.285 plastic bags
XII. Annual amount of plastic bags used in Bali:
a.) 2.940.000.000 plastic bags used by population in Bali + 59,136,000 plastic bags used by tourists
= 2.999.136.000 plastic bags
XIII. Annual loss of revenue to fishery sector in Bali due to plastic bag pollution:
a.) 0,8% (revenue loss due to plastic bag pollution) of 135.751.556 USD (revenues of fishery sector in Bali)
= 1.086.012 USD
XIV. Annual loss of revenue to tourism sector in Bali due to plastic bag pollution:
a.) 1,2% (revenue loss due to plastic bag pollution) of 4.626.800.000 USD (Bali tourism revenues are 40% of national tourism revenue)
= 55.521.600 USD
XV. Annual product costs of plastic bags for Bali:
a.) 0,015 USD (200 IDR) x 2.999.136.000 (annual use of plastic bags in Bali)
= 44.987.040 USD
XVI. Combined annual costs of plastic bags in Bali (loss in revenue from fishery sector, tourism, and plastic bag product cost):
a.) 1.086.012 USD (loss of revenue in Bali fishery sector) + 55.521.600 USD (loss of revenue in Bali tourism sector) + 44.987.040 USD (plastic bag product costs in Bali)
= 101.594.652 USD
Results
Based on an average of 700 plastic bags used per person in Indonesia, our calculations show that each year an estimated average of 182,7 Billion plastic bags are used across the archipelago.
Our estimations show that the hidden costs by plastic bag use and pollution in Indonesia could be as high as 2,92 Billion USD each year. Aside from the product cost of plastic bags (2,74 Billion USD) this result estimates costs arising from revenue loss in the fishery (32,3 Mio USD) and tourism (138,8 Mio USD) sector. More than an estimated 500,000 tons of Indonesia’s plastic bag waste, that is 40% of all plastic waste, ends up in the ocean. For the case of Bali our calculations indicate that the fishery sector is affected with a loss in revenue of slightly more than one million USD, but the annual loss in tourism revenues in Bali could be as high as 55 Million USD.
Estimates in this working paper are relying on data from different sources and previous studies and reports by a variety of institutions and scholars. Such estimations need to be interpreted very carefully, since they only approach realistic scenarios, but cannot fully represent reality. E.g. due to a lack of more specific regional data, the estimated % losses in tourism and fishery sectors had to be taken from global estimates. The specific % for Indonesia could therefore be lower, but also higher.
Another important aspect to consider is, that the annual use and consequent plastic pollution, is a cumulative problem. Plastic ending up in the ocean this year, adds to plastic pollution of the past decades, plastic pollution does not disappear, but stays for centuries in our oceans. If no significant change in behavior and policies is achieved, the pollution estimates are expected to increase to even much higher costs, bearing a growing hazard to the ecosystem and society’s prosperity and wellbeing.
References:
Aseantoday.com /APRINDO (2016)
https://www.aseantoday.com/2016/02/how-much-is-too-much-to-pay-for-plastic-bags/
Cole et al. (2011):
http://www.sciencedirect.com/science/article/pii/S0025326X11005133
DISPAR (2016):
http://www.tourism-master.com/2016/05/09/inside-knowledge-tourism-development-in-bali/
Gubernur Bali (2014):
https://acch.kpk.go.id/images/ragam/gn-sda/denpasar/01-PAPARAN-GUBERNUR-BALI_gn-sda.pdf
Jakarta Post (2012)
Jakarta Post (2015)
Jakarta Post /Greeneration (2016):
http://www.thejakartapost.com/news/2016/02/22/minimum-plastic-bag-tax-set-negligible-rp-200.html
Jambeck et al. (2015):
http://science.sciencemag.org/content/347/6223/768
Lexas/UNWTO (2014):
http://www.laenderdaten.de/wirtschaft/tourismus.aspx
Schirinzi et al. (2017)
http://www.sciencedirect.com/science/article/pii/S0013935117310770
Tribunnews (2017):
http://www.tribunnews.com/nasional/2017/08/10/bali-penyumbang-devisa-terbesar-di-sektor-pariwisata
UNEP (2014):
http://plasticdisclosure.org/plastic-disclosure-project/valuing-plastic-report.html
Worldbank (2017):
https://data.worldbank.org/country/indonesia
VERSI BAHASA INDONESIA:
Biaya Ekonomi Tersembunyi Pada Penggunaan Tas Plastik di Indonesia
Abstrak:
Toko retail dan pasar tradisional di Indonesia menawarkan tas plastik secara gratis untuk pembeli. Tetapi, saat banyak orang berpikir bahwa tas plastik adalah sesuatu yang wajar diberikan oleh toko retail, harga sesungguhnya dibayar perekonomian Indonesia dan masyarakat luas. Studi kami menemukan bahwasanya biaya ekonomi tersembunyi pada penggunaan tas plastik di Indonesia mencapai 2,91 Milyar USD lebih tiap tahunnya. Kami menggunakan estimasi global dari kehilangannya pendapatan di sektor perikanan dan pariwisata akibat polusi plastik, menerapkannya dengan data ekonomi Indonesia. Terbatasnya data pada biaya polusi lain, seperti kesehatan (tas plastik yang dibakar), kerugian dari banjir (tas plastik yang menyumbat saluran air) dsb., perhitungan terbatas pada biaya ekonomi dari penggunaan tas plastik pada orang Indonesia. Asumsi biaya dari penggunaan tas plastik di Indonesia mungkin melampaui tiga milyar USD setiap tahunnya.
Pengantar
Sekitar 500 juta tas plastik diestimasikan terdistribusi setiap harinya ke seluruh Indonesia (Jakarta Post /Greeneration 2016). Terbatasnya pelayanan pengelolaan sampah dari pemerintah ataupun sektor swasta kepada seluruh rumah tangga dan bisnis, sekitar 40% dari sampah plastik berakhir di laut sekitar kepulauan. Setelah Tiongkok, Indonesia adalah penyumbang terbesar kedua dari polusi plastik laut, terhitung 16% dari sampah plastik laut secara global (Jambeck et al 2015)
Menyebabkan dampak negatif yang signifikan pada aspek ekosistem dan sosial-ekonomi pada kehidupan masyarakat. Kehidupan laut menderita dan terjerat akan limbah plastik dan mencernanya, mengancam kesehatan reproduksi dan mengakibatkan kematian (e.g. Cole et al. 2011). Kesehatan manusia terpapar resiko. Baik melalui mikroplastik pada makanan laut atau air minum, polusi plastik cenderung memiliki efek buruk terhadap kehidupan manusia (e.g. Schirinzi et al 2017). Beberapa faktor berdasarkan produksi, penggunaan dan pencemaran dari tas plastik yang merugikan ekosistem dan kesejahteraan sosial ekonomi masyarakat.
Tujuan dan Keterbatasan Studi
Penelitian lebih lanjut untuk mengungkap dan menganalisa sejauh mana biaya ekonomi tersembunyi dari tas plastik dan limbah lainnya harus menjadi perhatian. Menilai dampak ini secara moneter akan memungkinkan pemerintah dan masyarakat mendapatkan informasi lebih baik akan biaya sesungguhnya., dan memudahkan kebijakan lebih sesuai dengan kebutuhan masyarakat adalah kerangka kerja yang lebih besar kontribusi studi ini.
Beberapa keterbatasan pada estimasi yang kami lakukan. Pertama, kami hanya memperhatikan bagian kecil dari biaya tersembunyi tas plastik. Fokus pada pendapatan yang hilang di sektor perikanan dan pariwisata. Kedua, kami hanya memperhatikan hilangnya pendapatan, namun terbatasnya data menyebabkan tidak dapat menyertakan biaya yang terkait, seperti; hilangnya lapangan pekerjaan dari sektor tersebut. Ketiga, kami tidak menyertakan biaya lingkungan pada produksi tas plastik, co; emisi CO2. Keempat, menghitung hilangnya pendapatan pada sektor perikanan dan pariwisata di Indonesia, kami mengandalkan data perkiraan global. Perkiraan ini, mungkin sangat bervariasi di berbagai negara, dengan preferensi dan sensitifitas wisatawan di wilayah masing-masing. Hanya melalui penelitian regional yang spesifik, secara bertahap kita akan dapat memperbaiki perkiraan dan validitas biaya yang terhitung.
Faktor biaya dalam studi ini mempertimbangkan biaya produksi tas plastik. Kami telah menyertakan harga yang toko retail harus bayar untuk tas plastik dan secara tidak langsung meneruskan biaya tersebut kepada konsumen.
Studi ini sebagai makalah oleh karena itu merupakan kontribusi pertama terhadap topik. Kami ingin mendorong berbagai pihak untuk memperbaiki estimasi dengan menambahkan data pada efek biaya yang timbul dari penggunaan dan pencemaran tas plastik. Idealnya seiring waktu kami dapat meningkatkan validitas estimasi dengan data yang relevan meliputi berbagai efek secara komprehensif dan akurat.
Analisa
Perhitungan kami berdasarkan pada data dari berbagai sumber yang berbeda untuk menyediakan angka relevan untuk memperkirakan kasus secara spesifik di Indonesia dan Bali.
Kami menggunakan data estimasi sebagai berikut:
1. Rata-rata tahunan jumlah tas plastik / per kapita di Indonesia
a.) 700 (Jakarta Post / Greeneration 2016)
2. Rata-rata bobot tas plastik di Indonesia
a.) 7 grams (penelitian sendiri)
3. Limbah plastik Indonesia yang berakhir di lautan:
a.) 40% (Jambeck et al. 2015)
b.) Total 1,29 Juta ton (Jambeck et al. 2015)
4. Populasi penduduk Indonesia:
a.) 261 Juta (Worldbank 2017)
5. Populasi penduduk Bali:
a.) 4,2 Juta (Jakarta Post 2012)
6. Wisatawan di Bali:
a.) 4 Juta per tahun, rata-rata hunian 7,7 hari (DISPAR 2016)
7. Nilai ekspor sektor perikanan di Bali:
a.) 751.566 USD (Gubernur Bali, 2015
8. Nilai produksi dari sektor perikanan di Indonesia
a.) 042.032.330 USD (Jakarta Post 2015)
9. Pendapatan pariwisata di Bali:
a.) 40% dari pendapatan nasional (Tribunnews 2017)
10. Pendapatan pariwisata di Indonesia:
a.) 567.000.000 USD (Lexas / UNWTO 2014)
11. Hilangnya pendapatan perikanan karena polusi plastik:
a.) 2% (UNEP 2014)
12. Hilangnya pendapatan pariwisata karena polusi plastik:
a.) 3% (UNEP 2014)
13. Biaya produk tas plastik:
a.) 200 IDR (Aseantoday.com/ ARPINDO 2016)
Estimasi:
I. Penggunaan tas plastik tahunan di Indonesia:
a.) 700 (tas plastik setahun per kapita) x 261.000.000 (populasi penduduk Indonesia)
= 182.700.000.000 tas plastik
II. Bobot total limbah tas plastik di Indonesia:
a.) 700.000.000 (penggunaan tas plastik tahunan di Indonesia) x 7 grams (bobot rata-rata per tas plastik)
= 1.278.900 ton
III. Limbah tas plastik tahunan yang berakhir ke lautan di Indonesia:
a.) 40% dari 1.279.900 ton
= 511.560 ton
IV. Prosentase limbah tas plastik dari keseluruhan limbah plastik di Indonesia:
a.) 560 ton (limbah tas plastik) / 1.290.000 ton (limbah plastik)
= 40%
V. Hilangnya pendapatan tahunan pada sektor perikanan Indonesia akibat limbah tas plastik:
a.) 40% (bagian dari limbah tas plastik) dari 2% (hilangnya pendapatan di sektor perikanan akibat limbah tas plastik)
= 0,8% hilangnya pendapatan di sektor perikanan akibat limbah tas plastik.
b.) 0,8% dari 4.042.032.330 USD (pendapatan tahunan sektor perikanan di Indonesia)
= 32.336.258 USD
VI. Hilangnya pendapatan tahunan pada sektor pariwisata Indonesia akibat limbah tas plastik:
a.) 40% (bagian dari limbah tas plastik) dari 3% (hilangnya pendapatan tahunan akibat limbah plastik)
= 1,2% hilangnya pendapatan di sektor pariwisata akibat limbah tas plastik.
b.) 1,2% dari 11.567.000.000 USD (pendapatan tahunan sektor pariwisata di Indonesia)
= 138.804.000 USD
VII. Biaya tahunan produk tas plastik di Indonesia:
a.) 0,015 USD (200 IDR) x 182.700.000.000 tas plastik
= 2.740.500.000 USD
VIII. Gabungan biaya tahunan tas plastik di Indonesia (hilangnya pendapatan dari sektor perikanan, pariwisata, dan biaya produksi tas plastik):
a.) 336.258 USD (hilangnya pendapatan di sektor perikanan) + 138.804.000 USD (hilangnya pendapatan di sektor pariwisata) + 2.740.500.000 (biaya produksi tas plastik)
= 2.911.640.258 USD
IV. Bobot tahunan limbah tas plastik di Bali:
a.) 4.200.000 (populasi penduduk Bali) x 700 (penggunaan tas plastik per kapita tahunan)
= 2.940.000.000 (jumlah penggunaan tas plastik oleh penduduk Bali)
b.) 2.940.000.000 (tas plastik) x 7 grams
= 20.580.000.000 gram
= 20.580 ton
c.) 4.000.000 (jumlah wisatawan tahunan ke Bali) x 7,7 hari (rata-rata hunian wisatawan)
= 30.800.000 hari wisata
d.) 700 tas plastik per tahun / 365 hari
= 1,92 rata-rata penggunaan tas plastik per kapita per hari.
e.) 30.800.000 (hari wisata) x 1,92 (rata-rata penggunaan tas plastik per kapita per hari)
= 59.136.000 penggunaan tas plastik per tahun oleh wisatawan Bali
f.) 59.136.000 tas plastik x 7 grams
= 413.952.000 grams
= 414 ton
g.) 20.580 ton (bobot tahunan limbah tas plastik populasi Bali) + 414 ton (bobot tahunan limbah tas plastik wisatawan Bali)
= 20.994 ton
X. Bobot tahunan limbah tas plastik yang berakhir ke lautan di Bali:
a.) 40% dari 20.994 ton
= 8.398 ton
XI. Jumlah tas plastik dari Bali yang berakhir di lautan:
a.) 398.000.000 grams dari limbah tas plastik / 7 grams
= 1.199.714.285 tas plastik
XII. Jumlah tas plastik yang digunakan di Bali:
a.) 940.000.000 tas plastik yang digunakan oleh penduduk Bali + 59.136.000 tas plastik yang digunakan wisatawan Bali
= 2.999.136.000 tas plastik
XIII. Hilangnya pendapatan tahunan sektor perikanan di Bali akibat limbah tas plastik:
a.) 0,8% (hilangnya pendapatan akibat limbah tas plastik) dari 135.751.556 USD (pendapatan sektor perikanan di Bali)
= 1.086.012 USD
XIV. Hilangnya pendapatan tahunan sektor pariwisata di Bali akibat limbah tas plastik:
a.) 1,2% (hilangnya pendapatan akibat limbah tas plastik) dari 4.626.800.000 USD (pendapatan pariwisata Bali mencapai 40% dari pendapatan pariwisata nasional)
= 55.521.600 USD
XV. Biaya tahunan produk tas plastik di Bali:
a.) 0,015 USD (200 IDR) x 2.999.136.000 (penggunaan tahunan tas plastik di Bali)
= 44.987.040 USD
XVI. Gabungan biaya tahunan tas plastik di Bali (kerugian dari hilangnya pendapatan di sektor perikanan, pariwisata dan biaya produk tas plastik):
a.) 1.086.012 USD (hilangnya pendapatan sektor perikanan di Bali) + 55.521.600 USD (hilangnnya pendapatan sektor pariwisata di Bali) + 44.987.040 USD (biaya produk tas plastik di Bali)
= 101.594.652 USD
Kesimpulan
Berdasarkan rata-rata 700 tas plastik yang digunakan tiap orang di Indonesia pertahun, perhitungan kami menunjukkan bahwa setiap tahun diperkirakan rata-rata 182,7 Milyar tas plastik digunakan di seluruh nusantara.
Perkiraan kami menunjukkan bahwa biaya tersembunyi dari tas plastik dan polusinya di Indonesia dapat mencapai 2,92 Milyar USD setiap tahunnya. Selain biaya produk tas plastik (2,74 Milyar USD), hasil ini memperkirakan biaya dari pendapatan yang hilang di sektor perikanan (32,3 Juta USD) dan pariwisata (138,8 Juta USD). Diperkirakan lebih dari 500.000 ton limbah tas plastik dari Indonesia, yaitu 40% dari seluruh sampah plastik berakhir di lautan. Pada kasus Bali, perhitungan kami menunjukkan sektor perikanan terdampak akan hilangnya pendapatan lebih dari satu juta USD, tetapi hilangnya pendapatan pada sektor pariwisata di Bali bisa mencapai 55 juta USD.
Perkiraan pada makalah ini mengandalkan data dari berbagai sumber dan studi serta laporan sebelumnya oleh berbagai institusi dan ilmuwan. Perkiraan tersebut perlu ditafsirkan secara hati-hati, karena mereka hanya mendekati pada skenario realistis, namun tidak dapat sepenuhnya mewakili kenyataan. Misal, karena terbatasnya data regional yang lebih spesifik, estimasi prosentase kerugian di sektor perikanan dan pariwisata harus menggunakan perkiraan global. Prosentase spesifik untuk Indonesia bisa jadi lebih rendah, tetapi bisa juga lebih tinggi.
Aspek penting lainnya yang perlu dipertimbangkan adalah, penggunaan tahunan dan konsekuensi limbah plastik, adalah masalah kumulatif. Plastik yang berakhir di lautan tahun ini, menambah polusi plastik dari beberapa dekade terakhir, polusi plastik tidak akan hilang, tetapi bertahan selama berabad-abad di lautan kita. Jika tidak perubahan perilaku dan kebijakan yang signifikan, perkiraan polusi akan meningkat dengan biaya yang lebih tinggi, membawa ancaman bahaya pada ekosistem dan kemakmuran serta kesejahteraan kehidupan masyarakat.
Referensi:
Aseantoday.com /APRINDO (2016)
https://www.aseantoday.com/2016/02/how-much-is-too-much-to-pay-for-plastic-bags/
Cole et al. (2011):
http://www.sciencedirect.com/science/article/pii/S0025326X11005133
DISPAR (2016):
http://www.tourism-master.com/2016/05/09/inside-knowledge-tourism-development-in-bali/
Gubernur Bali (2014):
https://acch.kpk.go.id/images/ragam/gn-sda/denpasar/01-PAPARAN-GUBERNUR-BALI_gn-sda.pdf
Jakarta Post (2012)
Jakarta Post (2015)
Jakarta Post /Greeneration (2016):
http://www.thejakartapost.com/news/2016/02/22/minimum-plastic-bag-tax-set-negligible-rp-200.html
Jambeck et al. (2015):
http://science.sciencemag.org/content/347/6223/768
Lexas/UNWTO (2014):
http://www.laenderdaten.de/wirtschaft/tourismus.aspx
Schirinzi et al. (2017)
http://www.sciencedirect.com/science/article/pii/S0013935117310770
Tribunnews (2017):
http://www.tribunnews.com/nasional/2017/08/10/bali-penyumbang-devisa-terbesar-di-sektor-pariwisata
UNEP (2014):
http://plasticdisclosure.org/plastic-disclosure-project/valuing-plastic-report.html
Worldbank (2017):