 (1) Draw a circle into the sand:
You can use your finger, or a stick.
Tip: You make it more perfect when you use a rope! Your friend holds the rope in the middle, and you – holding the rope on the other hand – walk around him while your finger drawing the line into the sand.
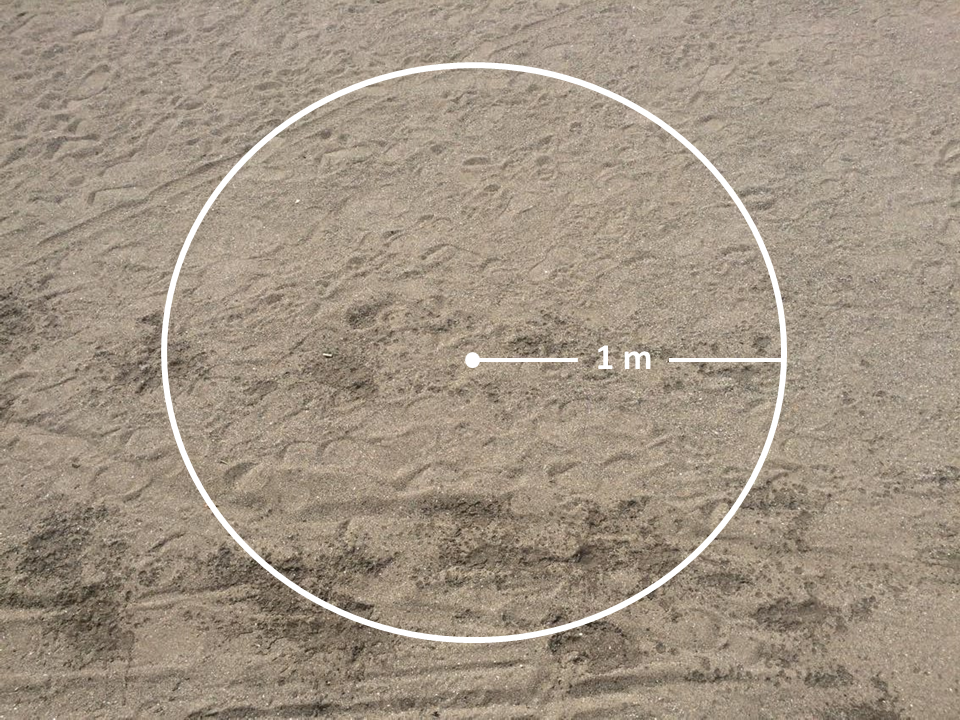
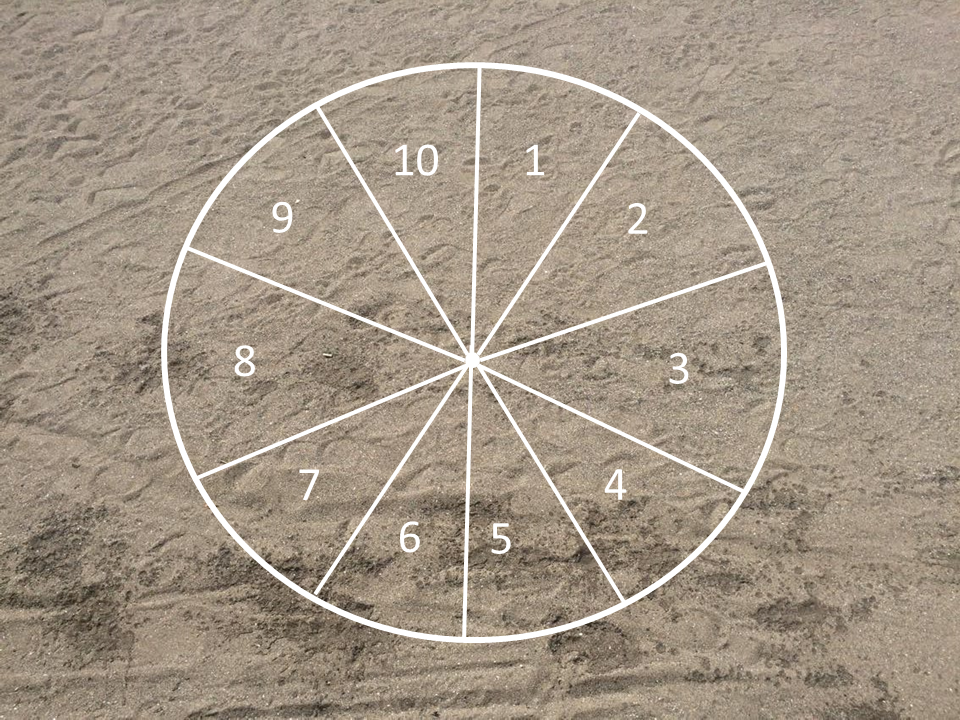
Draw straight lines into the sand, to create 10 equal sections. Use this image for orientation for where to draw the lines
(3) Collect, Sort and Count:
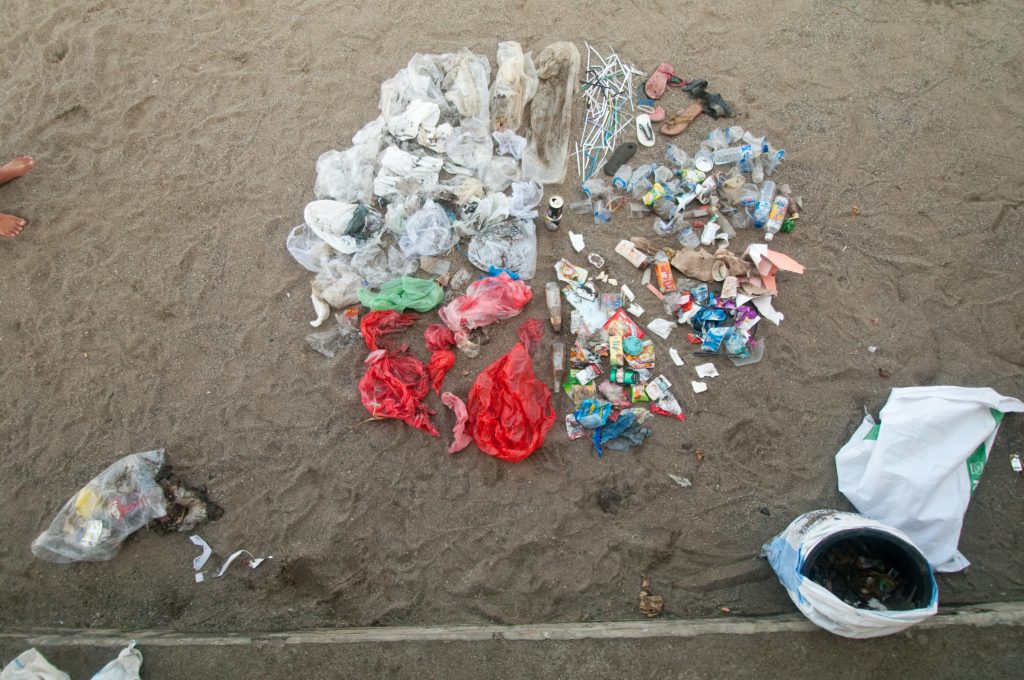
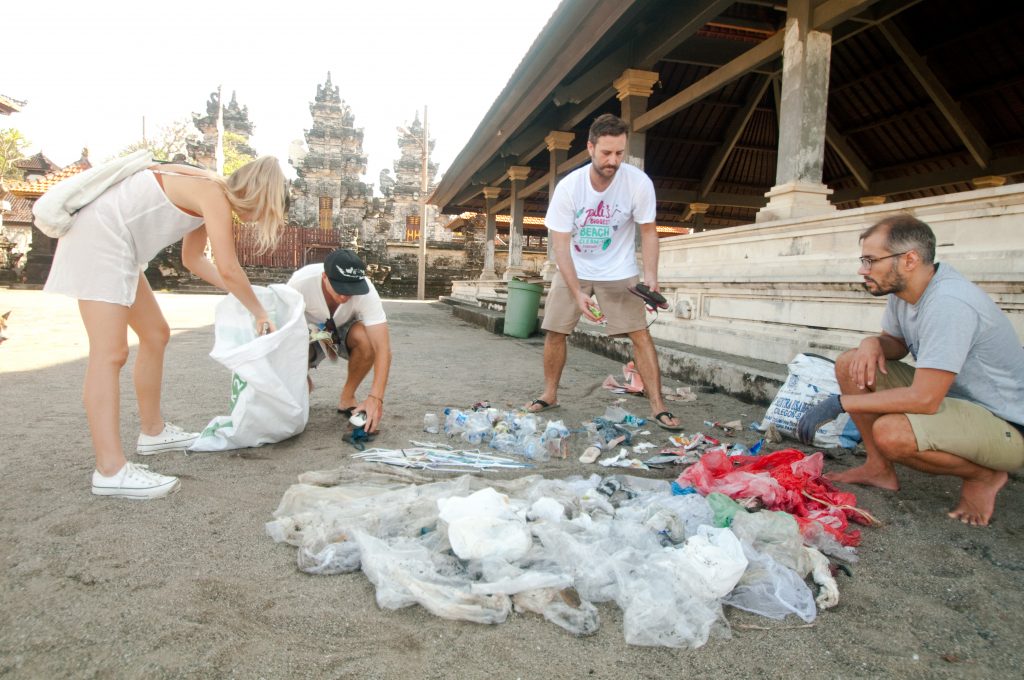
(a) Collect:
For the waste pie chart you only need to collect one bag of waste. Make sure you are the one walking across the beach before the others of your group. You need to pick up every non-organic piece of waste you come across. You can stop when the bag is full
(b) Sort:
You may want to sort them differently (check Ocean Conservancy for standards) but we used following categories: Straws, Plastic Bottles and Cups, Plastic Bags, Food Wrappings, Other Plastic Items, Shoes/Sandals, Glass Pieces/Bottles, Cigarette Ends, Cans, other most frequent item.
(c) Count the items in each category
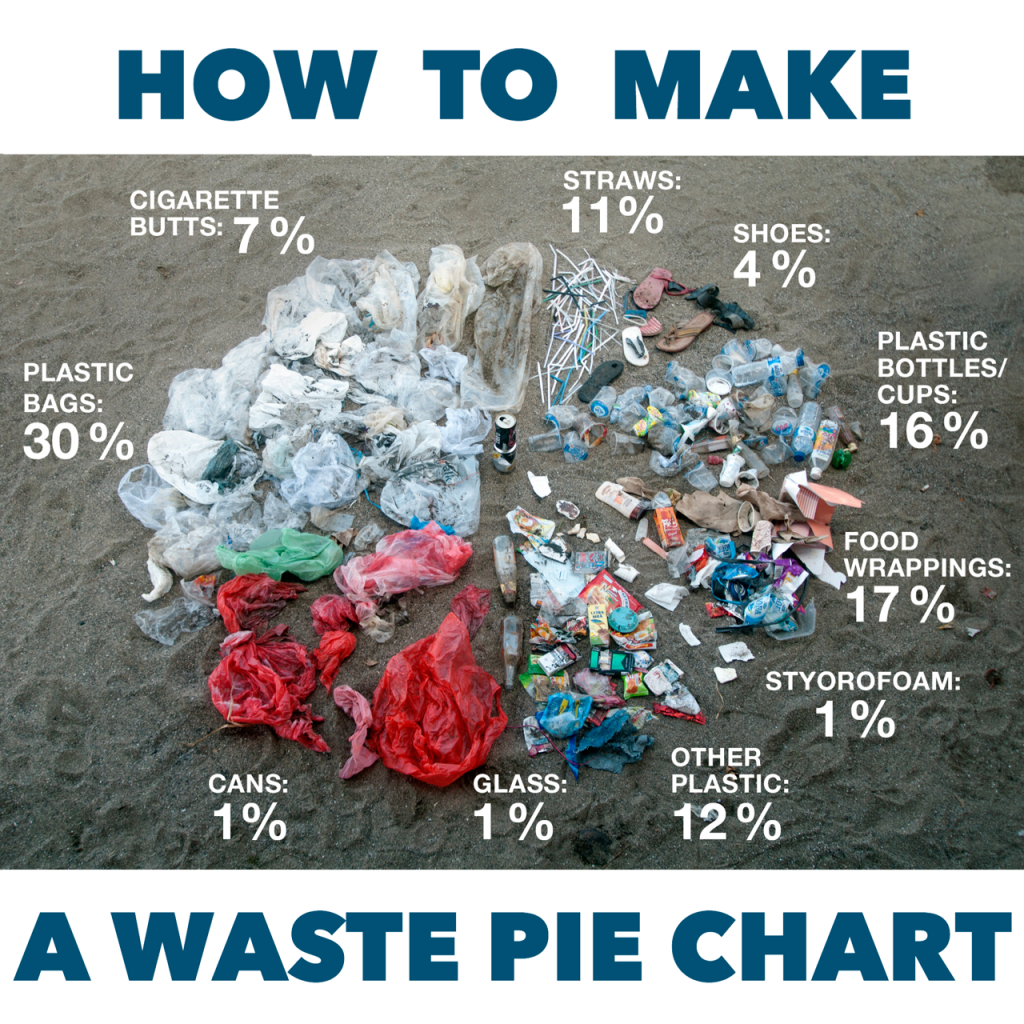
(4) Calculate (it’s easy ![]() 😉 ) and fill the chart:
😉 ) and fill the chart:
(a) Once you know how many items you have in each category, add them up to get your total # of waste items.
(b) to get the percentage and know how to fill the pie you need to do this: You calculate e.g. # of Straws/ total # of waste items. You can use the calculator on your phone: You will get a number like 0.1521 , which means 15% of the waste you collected is straws. Do this calculation for each category.
c) Once you have the percentage of each category, you can start filling the pie with waste. Each of your 10 pie slices is 10%.
So if you have 15% straws. You fill one slice and another 1/2 slice with straws.
You continue like this with all waste categories.
Congratulations, your waste pie chart is done!
You may want to edit the photo into an info-graphic and add percentages for each category.
Add #MakingOceansPlasticFree and post it on Instagram or Facebook so we can gather different waste pie charts and learn what others have found